




Tracking & reports
Live overviews and event reports
Capture the information you need on sales, waitlists, returns, attendance, event arrivals & incidents
tracked in real time, compiled in comprehensive records

Vital data made visible
When you can’t track and review ticket sales and key event data it is difficult to identify where you can make improvements to your events, and the task of compiling financial records can become onerous. We have designed Hubbaly to give you the information you need when you want it.
In the run up to, and during events we enable you to:
- See live ticket sales figures.
- Track waitlists, return requests and the transactions between these two lists.
- See which tickets have been transferred.
- Track complimentary tickets; which are awaiting a response and which have been accepted or refused.
- Identify which influencers’ discount codes are being used to buy tickets.
- Track the busy times at the door of your events.
- See live door scanning data at your events of both staff and attendees.
- Be alerted to live incidents as they are logged at events.

After events our reports allow you to review:
- All financial and payment figures.
- A comprehensive sales record.
- The details of any incidents.
- Staff and patron attendance data including: patrons’ ticket type, the time their ticket was scanned, and confirmation of any completed event forms or waivers they signed.

Analytics
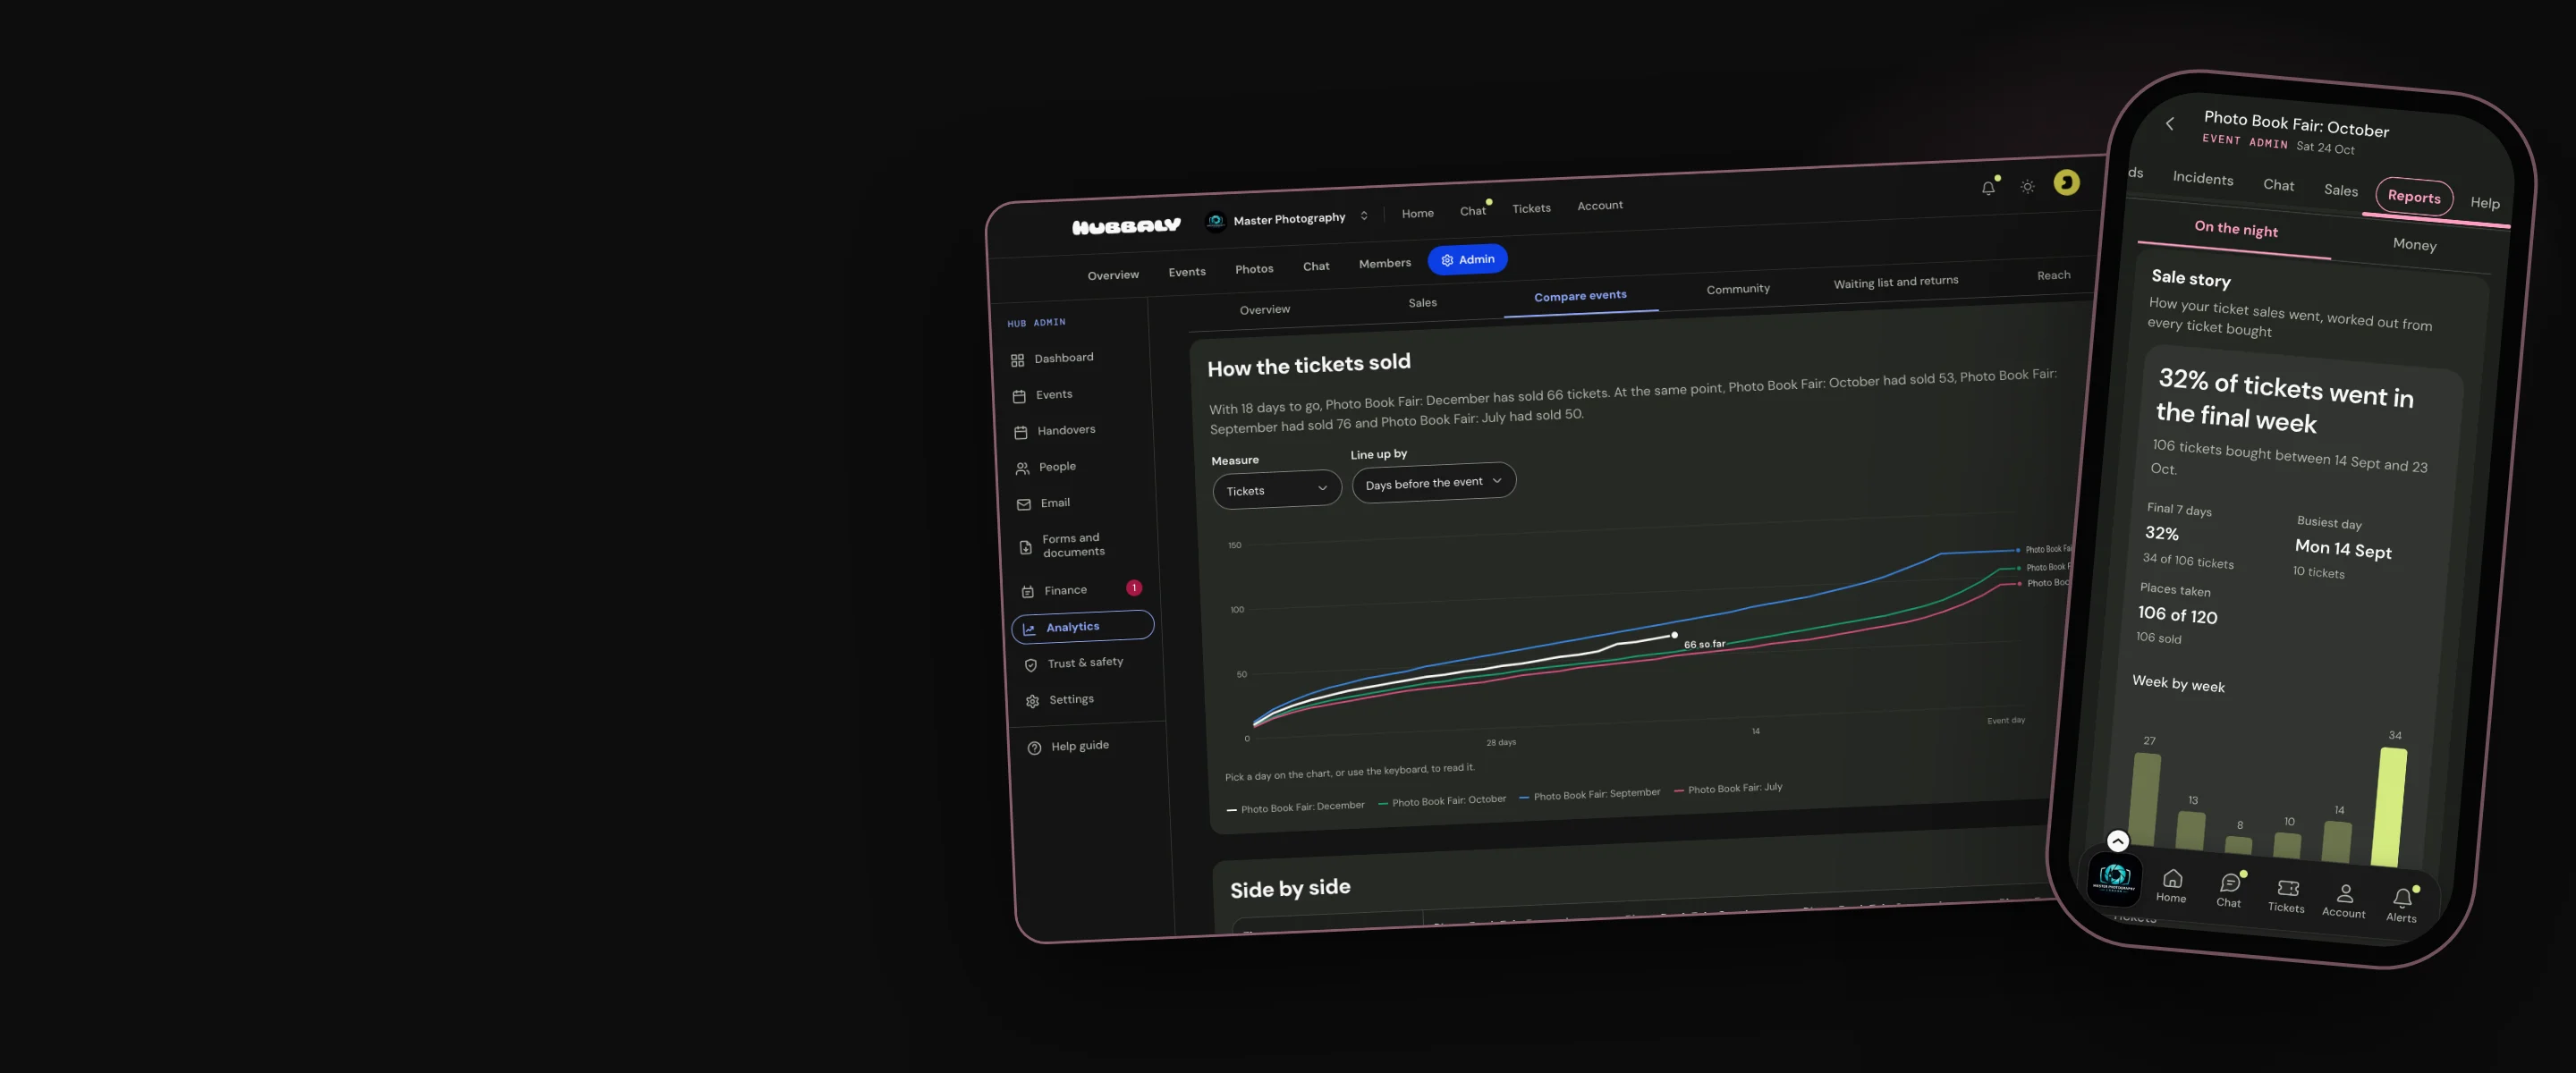
Your hub’s analytics brings all of your events’ data together, so you can compare how each one sold, and how your community is growing.
Your hub analytics lets you:
- Compare an event with your earlier events; from ticket publication to the end of the event key data points clearly overlaid for review.
- See which tickets people chose, what they paid, how far ahead they bought and when they arrived.
- Know your regulars, the first-timers who came back and anyone drifting away; counted from check-ins at the door.
- See what returned tickets did for your events attendance: numbers of places filled, and people on the waitlist who managed to acquire tickets.
- See how many people visited your event pages and where they came from, without identifying anyone.

You can download your reports from your hub at any time.

Limits
- Hubbaly shows where your page’s visitors came from, but not which link sold a ticket. Give each partner their own discount code to see what they sell.
- To see how your sales compare with what you usually sell, and how many tickets you’re likely to sell, compare an event with three of your earlier events.
- A sale story appears once 20 tickets have been bought.
Our promise
We will provide you with accurate, comprehensive sales and event data; easy to read or download.
Questions
Who can see and download event overviews and reports?
Your hub’s owners, admins and managers can see every event’s reports and your hub’s Analytics, and download an event’s report as a PDF or a spreadsheet. Your hub’s finance pages are for owners and admins. You can also give event staff permission to see an event’s reports.
Can I compare an event with my earlier ones?
Yes. On an event’s Sales page, choose the earlier events it is most like, and Hubbaly lines up their sales by days before each event. With three or more, you also see your usual pace and a likely finish.